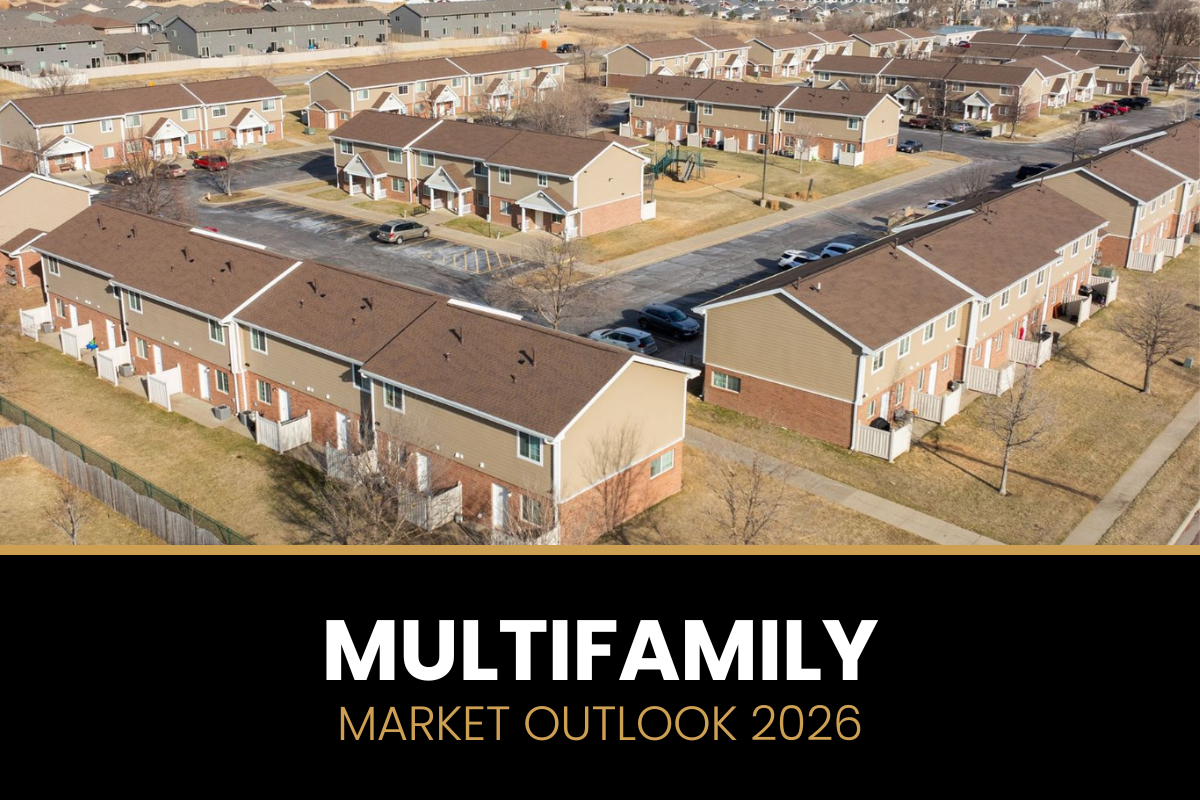
Multifamily Market: Working Through Supply, Positioned for Recovery
By Alex Soundy, CCIM, SIOR
Bender Commercial Real Estate | 29th Annual Market Outlook Series | 9-minute read
The Sioux Falls multifamily market has been in an absorption cycle for the past two years. After record permit years in 2021, 2022, and 2023, a large volume of new units entered the market simultaneously, pushing vacancy above historical norms. Property managers responded with concessions and discounted rents to maintain occupancy, and investors faced a more challenging acquisition environment.
That process — necessary, healthy, and finite — is progressing. The data heading into 2026 suggests the market is approaching its inflection point: supply is moderating, vacancy is improving, and investment activity is accelerating.
This post is part of Bender Commercial’s 29th Annual Market Outlook series, based on presentations given February 19, 2026. For more context, watch the full presentation video or see the companion posts on the Sioux Falls land, retail, office, and industrial markets.
National Multifamily: Supply Has Finally Reset
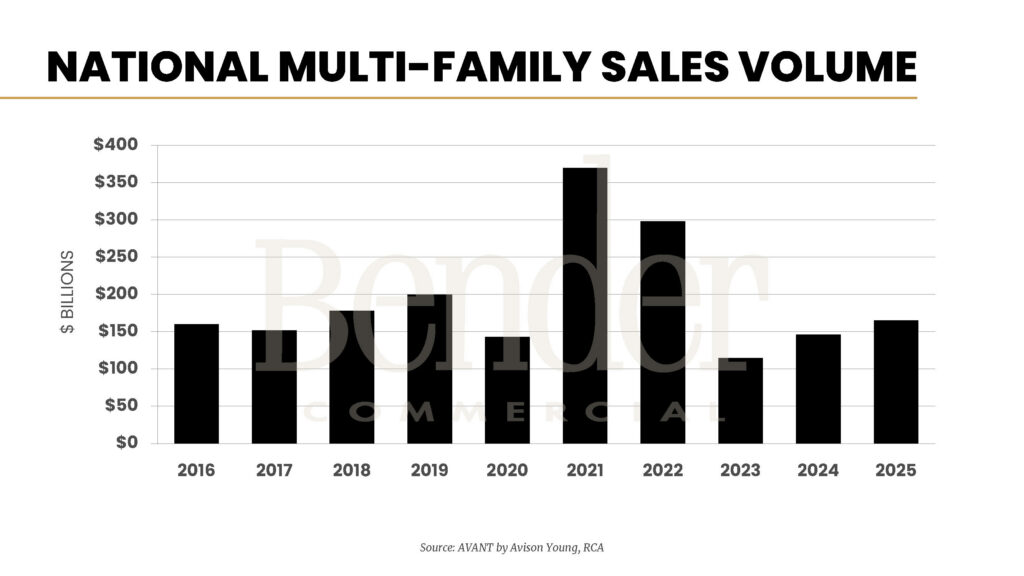
At the national level, the multifamily market is entering 2026 with improved supply dynamics. Approximately 270,000 new units are projected for delivery nationally — the lowest annual total in a decade, down roughly 30% year over year. Permitting and new construction starts are at historic lows. For owners of existing assets, this is meaningful: less new supply means stronger leasing velocity, faster vacancy reduction, and reduced concession pressure.
National multifamily investment sales reached approximately $165 billion in 2025, up roughly 13% from 2024 — continuing a recovery from the 2023 trough, though well below the $365+ billion peak of 2021. The direction is clearly positive.
The Structural Case for Multifamily: Renting vs. Owning
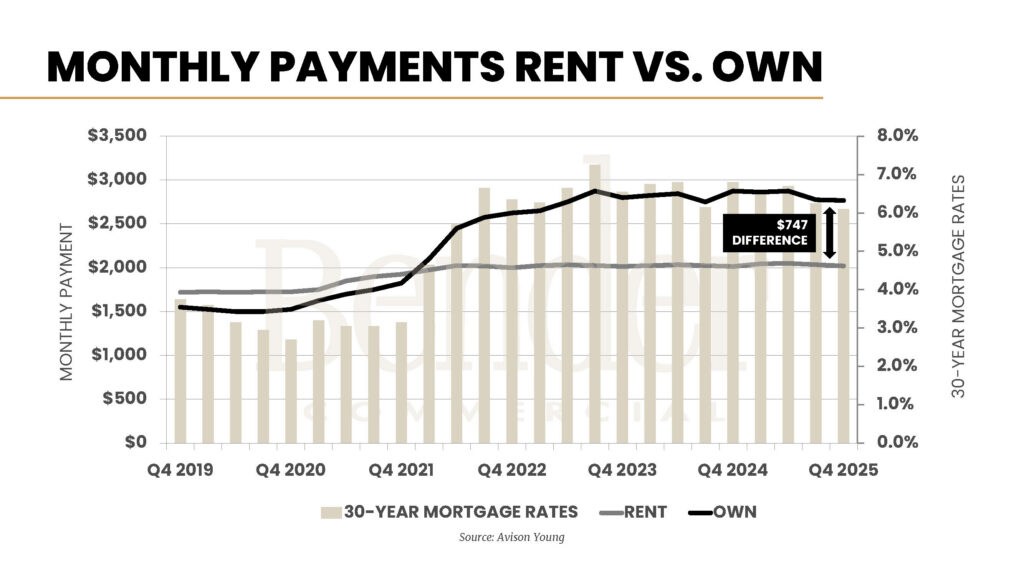
The chart above may be the most structurally important data point in this section for long-term investors. The gap between the monthly cost of renting and the monthly cost of owning a median-priced home reached approximately $747 per month at the end of 2025 — and that gap widens further when property tax and insurance escrow is included in the ownership cost.
This is not a temporary dislocation. The average age of the first-time homebuyer in the U.S. rose from 33 years old in 2020 to 40 years old today — a seven-year demographic shift in five years, reflecting how difficult the path to homeownership has become for younger households. As long as this affordability gap persists, rental demand will remain structurally supported regardless of short-term vacancy fluctuations. Population growth drives near-term occupancy. The rent-versus-own gap is what makes multifamily a durable investment category over a decade or more.
Capital Is Back: What’s Improving Deal Economics
Several developments have improved multifamily deal economics entering 2026:
- Expanded agency lending: Both Freddie Mac and Fannie Mae increased 2026 lending limits by $8 billion each — a 20% increase — expanding available agency debt for multifamily acquisitions.
- Narrowing bid-ask gap: Sellers who held out for 2021-era pricing have increasingly adjusted expectations. Buyers with access to improved financing are more willing to compete on price. Deals that did not pencil 12 to 24 months ago are beginning to work.
- Pretend-and-extend nearing its end: Over the past 12 to 18 months, many lenders extended and modified loans for borrowers who purchased at the 2021 peak and faced difficult refinancing environments. That forbearance period is nearing its end. Lenders are increasingly requiring decisions — sell, recapitalize, or face formal resolution. This will generate additional transaction volume in 2026 and beyond.
- Sustained investor appetite: Some industry reports suggest that as much as 60% of commercial real estate dry powder is earmarked for multifamily. The asset class has not lost its appeal — the supply cycle simply made deal underwriting difficult for a period.
Sioux Falls Multifamily Permits: The Supply Pipeline Is Moderating
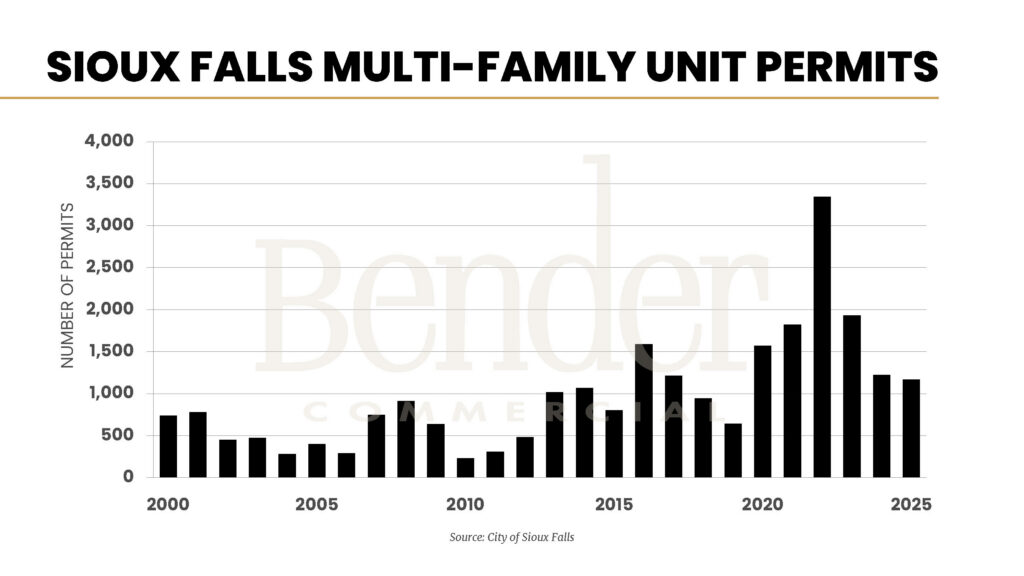
The 25-year permit history shows the dramatic arc of Sioux Falls multifamily construction. After a quiet decade in the 2000s and early 2010s, permits surged through the mid-2010s, then peaked at over 3,300 units in 2022 alone. The subsequent two years — 2024 (1,224 units) and 2025 (1,168 units) — show a significant and sustained moderation.
This pullback is the natural corrective to the overbuilding period. Fewer new units entering the pipeline means fewer deliveries competing for renters in 2025 and 2026. The absorption cycle will run its course, vacancy will improve, and conditions for new development will eventually return — but that timeline is measured in years, not months. Developers are waiting for more favorable conditions before committing to new ground.
Sioux Falls Multifamily Vacancy Rate: Elevated but Heading in the Right Direction
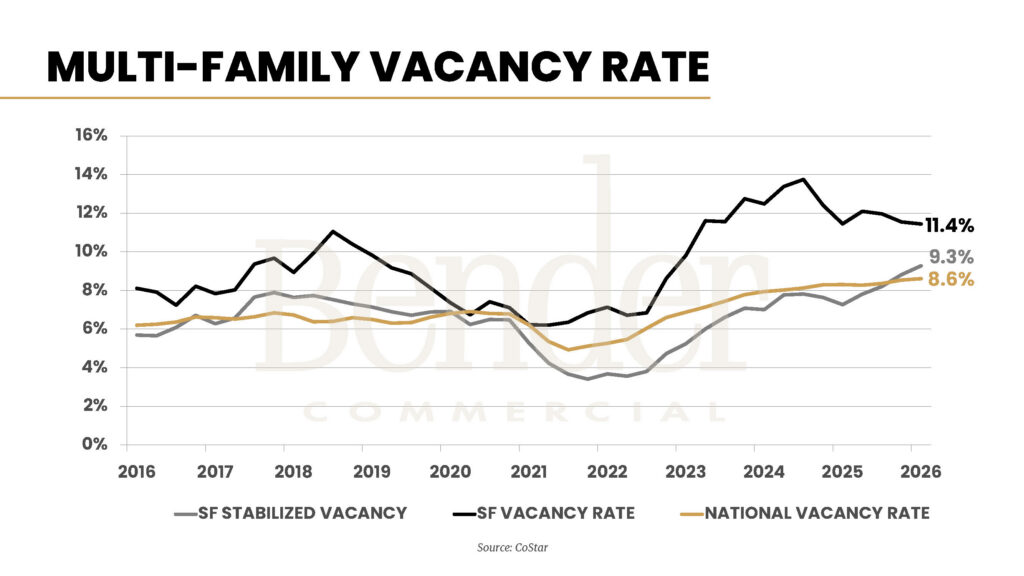
Sioux Falls finished 2025 with two distinct vacancy readings:
- Stabilized vacancy rate — 9.3%: This excludes properties still in their initial lease-up phase. At 9.3%, the stabilized market is elevated compared to the national rate of 8.6% but below the market’s recent peak and improving.
- Overall vacancy rate — 11.4%: This includes all properties, including new construction still filling for the first time. This is the more conservative and accurate read of total market conditions.
Both measures are heading downward, and with fewer new units in the pipeline, the trajectory should continue to improve through 2026 and into 2027. Returning to the 6–7% stabilized vacancy range that characterized the market pre-2022 is the path of normalization the data points toward.
Sioux Falls Effective Rent: Stable, Waiting for the Turn
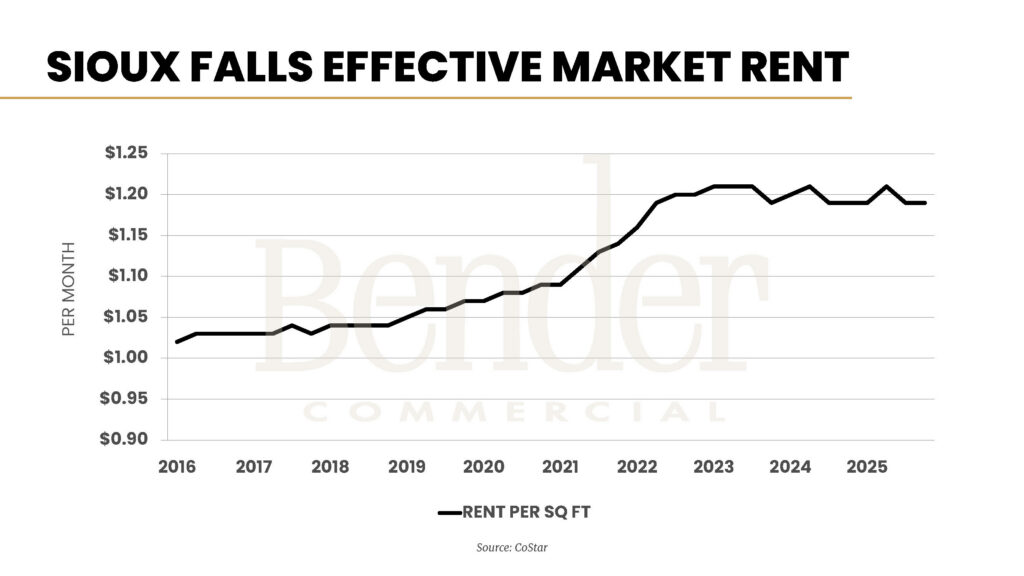
Effective market rent — actual net rent after concessions — has been essentially flat in Sioux Falls since 2022. The rapid appreciation from 2020 to 2022 was followed by three years of stagnation as property managers competed for renters in a high-vacancy environment, offering concessions that suppressed effective rent even when face rents nominally held.
As vacancy declines and concessions burn off, effective rents are expected to recover. Bender Commercial predicts rental rate growth of 3% or more in 2026 as the market’s supply-demand balance improves.
How Sioux Falls Multifamily Compares Regionally
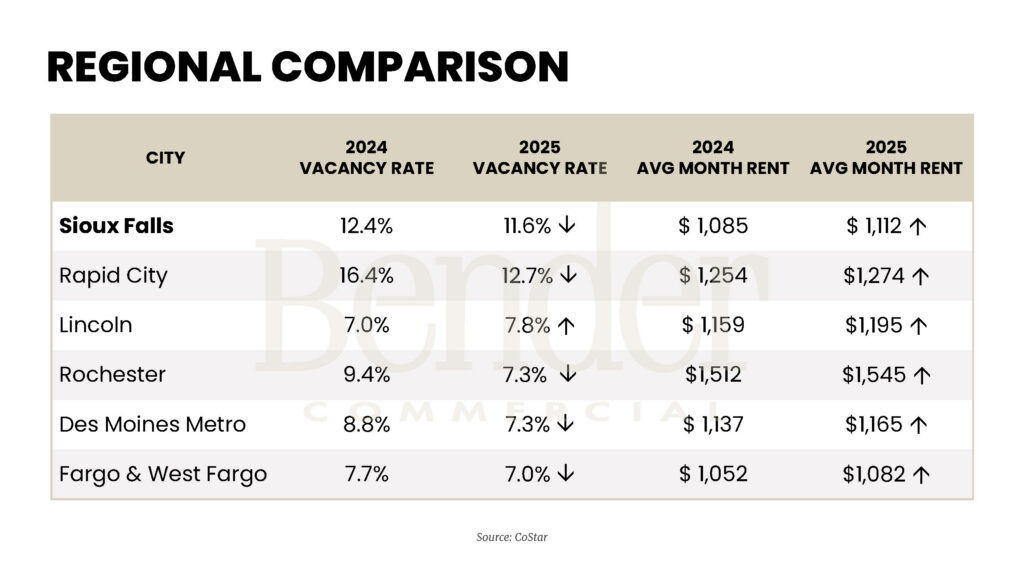
The regional comparison table provides important context:
- Sioux Falls: 4% → 11.6% vacancy (CoStar stabilized measure). Average monthly rent grew from $1,085 to $1,112. Elevated, improving.
- Rapid City: 4% → 12.7%. The most dramatic improvement in the peer group; still the highest vacancy, but both South Dakota cities are recovering from aggressive supply cycles.
- Lincoln, NE: 0% → 7.8%. The only peer market to see vacancy increase — suggesting Lincoln may be entering its own supply cycle.
- Rochester, MN: 4% → 7.3%. Improving, supported by the Mayo Clinic expansion driving population growth.
- Des Moines Metro: 8% → 7.3%. A stronger market that has absorbed supply more efficiently.
- Fargo & West Fargo: 7% → 7.0%. Stable, with modest rent growth.
The elevated vacancy in both South Dakota cities reflects a common dynamic: both markets grew aggressively, attracted development capital, and delivered more units than short-term demand could absorb. Neither market is in structural distress. Both are absorbing their supply and will emerge with stronger fundamentals once the cycle runs its course.
Sioux Falls Multifamily Investment Sales in 2025
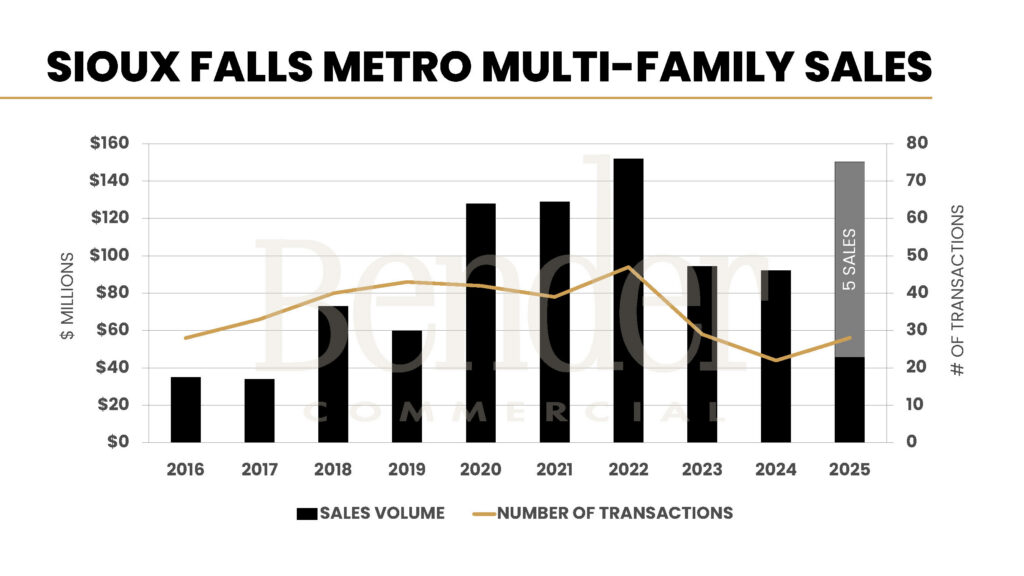
Multifamily investment sales in Sioux Falls totaled just over $150 million in 2025 across 28 transactions — just below the record $152 million set in 2022, but achieved with 19 fewer transactions. Five transactions accounted for 70% of the total volume at approximately $104 million combined. Notable 2025 sales tracked by Bender Commercial:
- Huntington Village, 3500 S Grand Slam Ave — April 2025: 180 units sold for $30,800,000 ($171,111/unit). The buyer assumed existing low-rate HUD financing, enabling a higher purchase price than conventional financing would have supported — an important lesson for sellers with assumable debt.
- West Briar Commons, 2805 S Hidden Pl — September 2025: 152 units sold for $24,000,000 ($157,894/unit).
- Cleveland Park Townhomes, 1800 S Cleveland Ave — July 2025: 126 units sold for $13,390,000 ($106,269/unit). Seller-carried financing helped bridge the bid-ask gap.
- Williamsburg Townhomes, 505 S Wheatland Ave — August 2025: 110-unit LIHTC Section 42 property sold for $8,809,000 ($80,082/unit).
- 3 Falls Apartments, 3600 E 6th St — December 2025: 60 units sold for $5,590,000 ($93,167/unit).
The range of per-unit pricing — from $80,082 to $171,111 — reflects meaningful variation driven by age, quality, financing terms, and location. Creative financing structures (assumable agency debt, seller carry) appeared prominently in several transactions, a pattern expected to continue in 2026 as buyers and sellers bridge valuation gaps.
Sioux Falls Multifamily Market Outlook for 2026
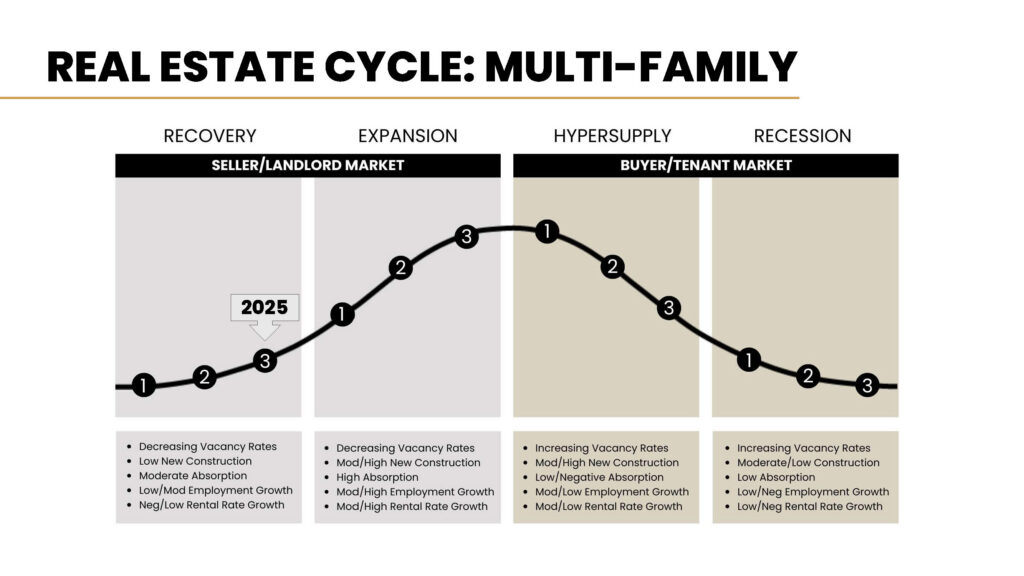
Bender Commercial positions the Sioux Falls multifamily market at the tail end of the recovery phase as of 2025, with an anticipated move into expansion in 2026 as vacancy pulls back and rental rate growth resumes. Specific predictions from the 2026 Market Outlook:
- Permits: Fewer than 1,200 units for the second consecutive year as construction costs, above-average vacancy, and cautious developer sentiment continue to moderate new activity.
- Vacancy: Expected to continue declining with fewer new deliveries competing for renters.
- Rental rates: Projected to grow 3%+ as concessions burn off and occupancy improves.
- Investment sales: 2026 is expected to be a record year — potentially the first year in market history to exceed $200 million in total Sioux Falls multifamily sales volume.
For investors evaluating income-producing multifamily properties in Sioux Falls, or owners considering disposition timing, the current market offers a mix of challenges and opportunities best navigated with current, local data. Bender Commercial has tracked multifamily transactions in this market for nearly three decades.
Ready to talk about what this means for your real estate decisions?
Bender Commercial has guided clients through three decades of Sioux Falls market cycles. Whether you’re evaluating an investment, planning a move, or simply trying to understand what the data means for your business, we’d welcome the conversation.