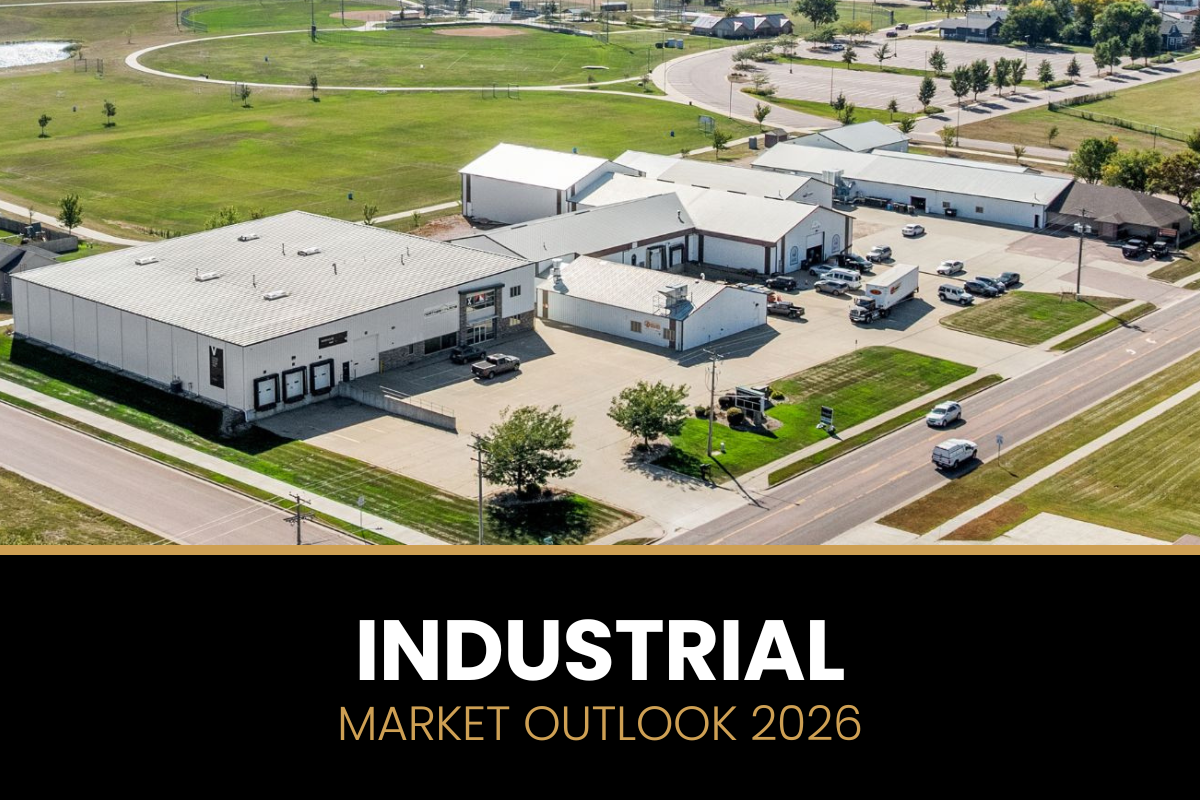
Industrial Market: Record Sales, Rising Vacancy, and a Self-Correcting Market
By Rob Fagnan, SIOR
Bender Commercial Real Estate | 29th Annual Market Outlook Series | 9-minute read
For more than a decade, the Sioux Falls industrial market was one of the most consistently performing asset classes in the region — low vacancy, rising rents, strong absorption, and investor demand that drove steady appreciation. 2025 marked an inflection point. Vacancy reached its highest level in over 20 years. Net absorption fell below the 10-year average. Asking rents declined modestly. And yet — industrial investment sales hit an all-time record of over $160 million.
Understanding the distinction between those two data streams — operating fundamentals and investment activity — is key to reading where the Sioux Falls industrial real estate market goes from here.
This post is part of Bender Commercial’s 29th Annual Market Outlook series, based on presentations given February 19, 2026. For more context, watch the full presentation video or see the companion posts on the Sioux Falls land, retail, office, and multifamily markets.
National and Midwest Industrial: Context for the Local Story
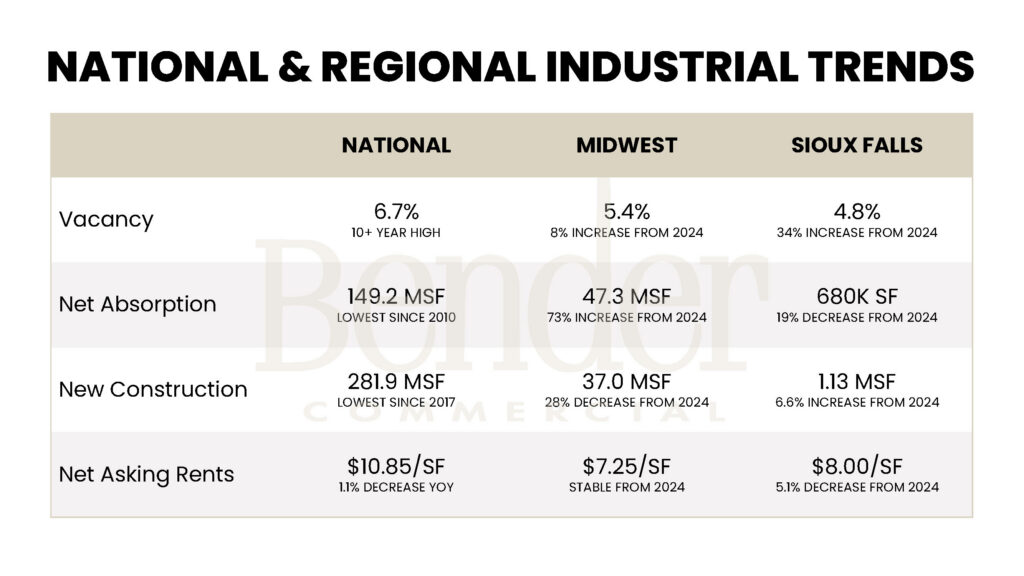
The comparison table above provides essential context. Nationally, industrial vacancy hit a 10-year high at 6.7%, net absorption fell to its lowest since 2010, and new construction reached its lowest level since 2017. The post-pandemic industrial boom has definitively run its course nationally, and the market is working through an oversupply cycle.
The Midwest told a more encouraging story. Regional vacancy ticked up to 5.4%, but net absorption increased 73% year over year — driven by strong leasing activity in Q3 and Q4 — and new construction pulled back 28%. Rents held stable at approximately $7.25 per square foot. The Midwest industrial market is absorbing its overhang faster than many other regions.
Sioux Falls sits between these two pictures. At 4.8% vacancy, the local market remains below both national and Midwest benchmarks — but the pace of increase from prior lows has been sharper. Net absorption pulled back 19% while new construction grew 6.6%, widening the supply-demand gap pushing vacancy higher. Closing that gap is the central task for 2026.
The Sioux Falls Industrial Universe: 34 Million Square Feet
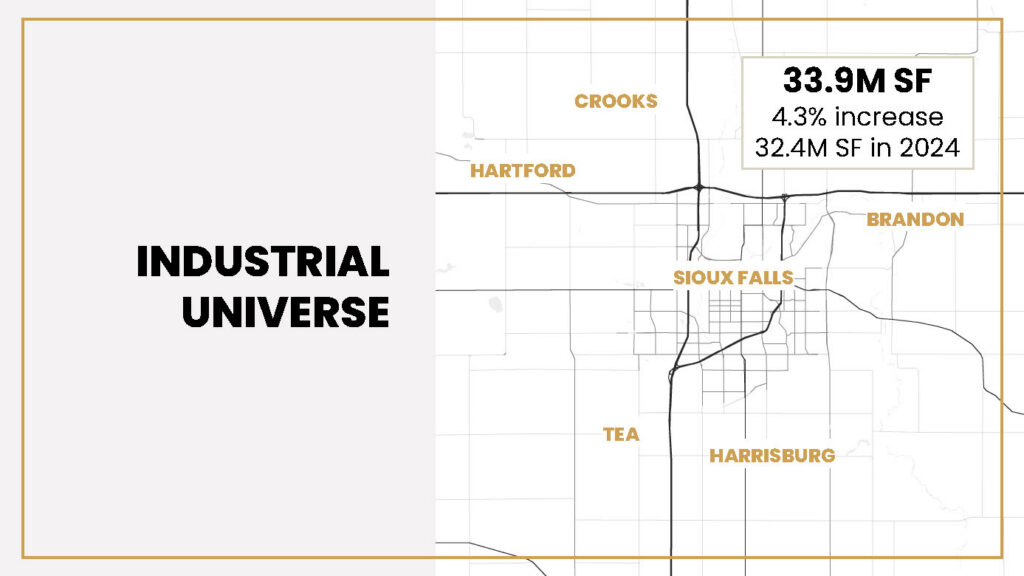
The Sioux Falls industrial market encompasses approximately 33.9 million square feet across the metro area — a 4.3% increase from 32.4 million square feet in 2024. The geographic spread matters: while the core of the market remains within Sioux Falls, suburban industrial parks in Brandon, Corson, and surrounding communities have absorbed meaningful activity, and that trend is expected to continue as city land supplies tighten.
New Industrial Construction: At the 10-Year Average
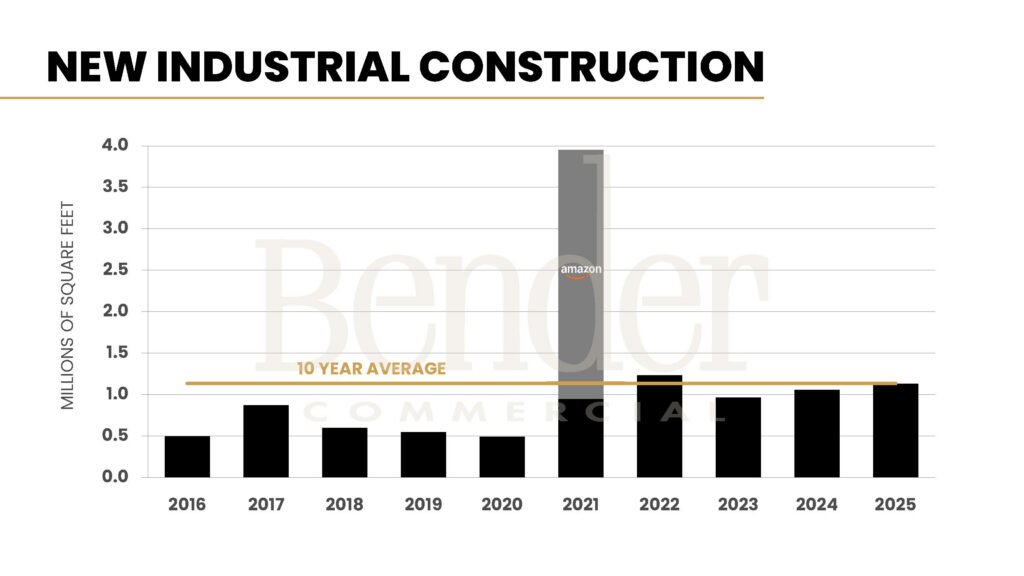
New industrial construction in 2025 came in at approximately 1.13 million square feet — right at the 10-year average. The year was defined by three significant owner/tenant-occupied projects:
- CJ Foods — 700,000 SF: A state-of-the-art food manufacturing facility and one of the most significant economic development wins in the Sioux Falls area in recent years.
- Amazon — 125,000 SF: A last-mile distribution center replacing their previous 60,000 SF location on 60th Street North. Amazon nearly doubled their Sioux Falls footprint, reflecting continued confidence in the market as a regional distribution hub.
- Silencer Central — 55,000 SF: A warehouse expansion on their 60th Street North campus by a fast-growing Sioux Falls company continuing to invest locally.
On the speculative side, Velocity Buildings delivered two 20,000 SF buildings in Sioux Empire Development Park 8 East, and the Plum Building — a 33,800 SF flex building in the Corson Branding Park — was completed. Speculative construction has moderated from peak years, which is appropriate given current vacancy conditions.
Net Absorption: Below the 10-Year Average
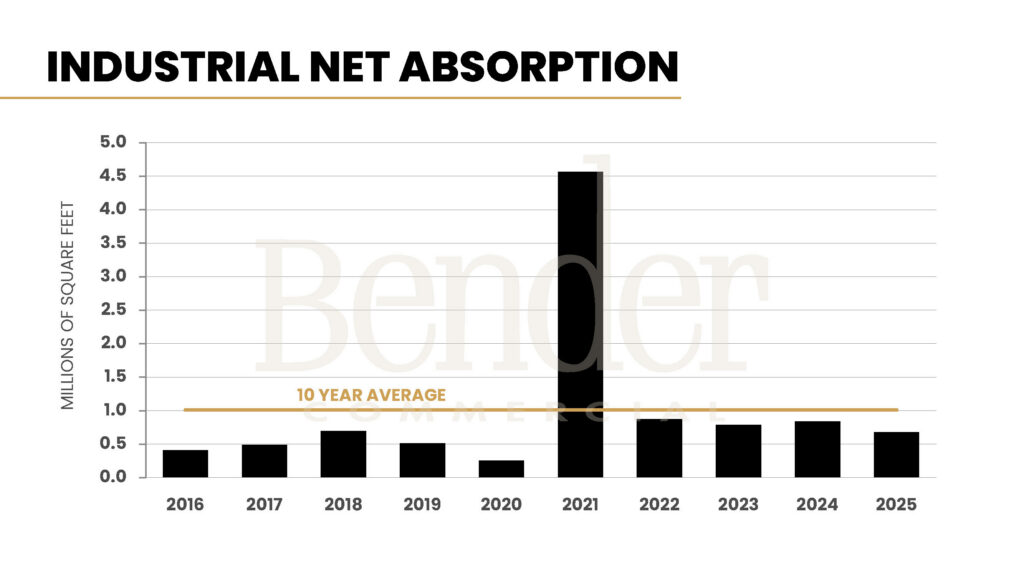
Net absorption — the net change in occupied space — came in at approximately 680,000 square feet in 2025, roughly 20% below the 10-year average. The chart above shows the dramatic 2021 spike driven by Amazon and other large users, followed by a return to more moderate levels. Construction continued near the 10-year average while absorption trailed — that gap is what pushed vacancy higher.
This is not a demand collapse. The market continues to see consistent occupier activity across a range of uses and sizes. It is a timing and composition issue: large owner-user buildings absorb space in significant increments when they open, but they take time to complete. Meanwhile, speculative buildings add to available inventory faster than the market can absorb in aggregate.
Industrial Vacancy Rate: Highest in 20+ Years — But Still Below Peers
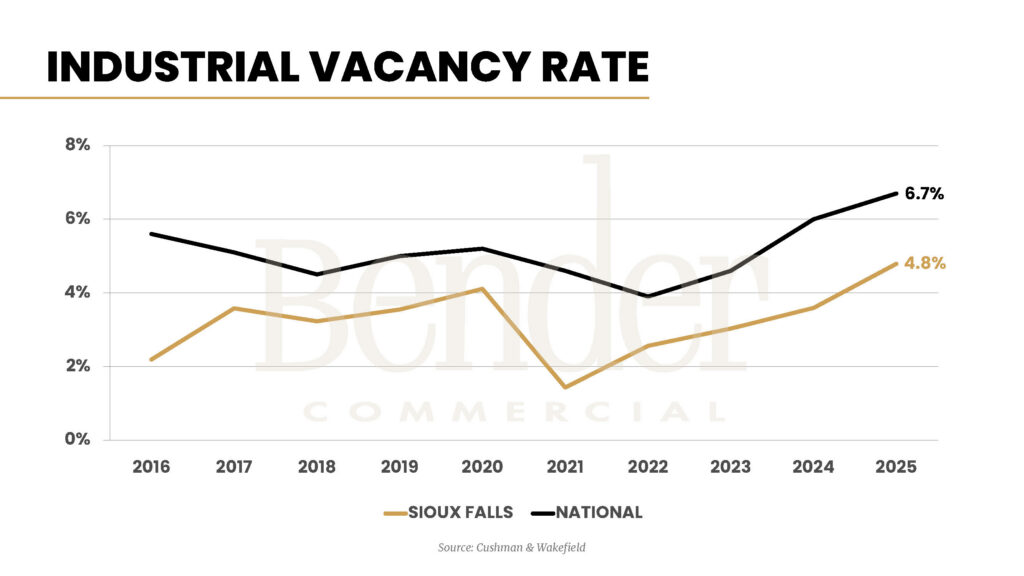
At 4.8%, Sioux Falls industrial vacancy is at its highest point in more than 20 years of tracked data. The vacancy rate chart shows the local market spent most of 2016–2021 at 2% or below — a historically tight condition. The current 4.8% represents normalization from those extremes, not collapse.
For perspective: Sioux Falls industrial vacancy at 4.8% is still below the national industrial benchmark of 6.7% and below most Midwest peers. The challenge is relative to Sioux Falls’ own history, not relative to market peers. Industrial tenants in this market still operate in a more competitive leasing environment than they would in most comparable cities.
Investment Sales: An All-Time Record Despite Higher Vacancy
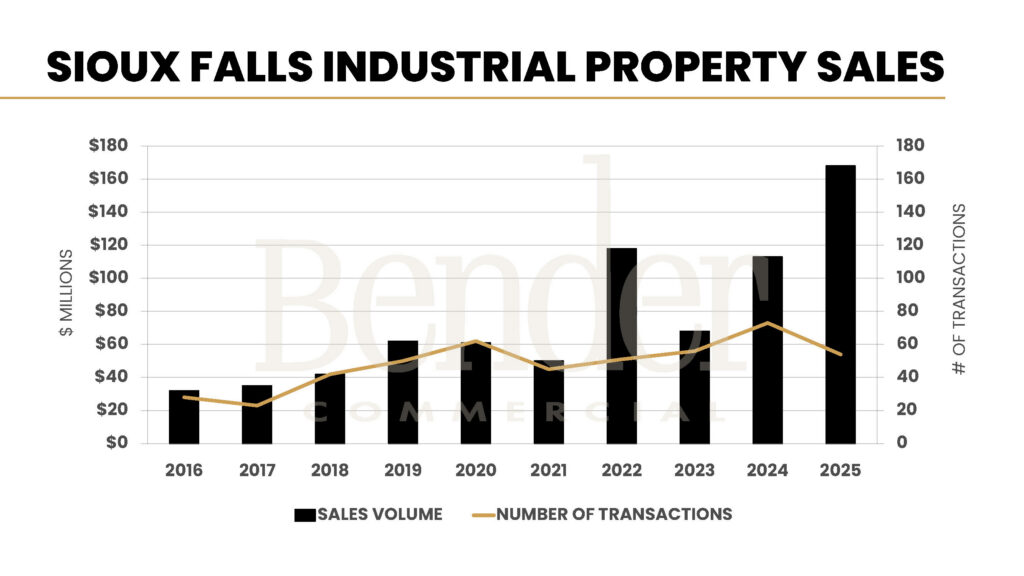
While operating metrics show a market under supply pressure, investment sales tell a completely different story: over $160 million was transacted in Sioux Falls industrial real estate in 2025 — the most ever recorded in the market — across approximately 54 transactions.
Sophisticated investors look through near-term vacancy cycles to underlying fundamentals: a growing metro, a diversified industrial tenant base, replacement cost dynamics that support current pricing, and cap rates that remain competitive. Three institutional transactions highlighted in the companion Capital Markets post — including the $64.3 million Owens & Minor/Avera building at a 7.0% cap rate — exemplify the institutional-scale interest the market is attracting.
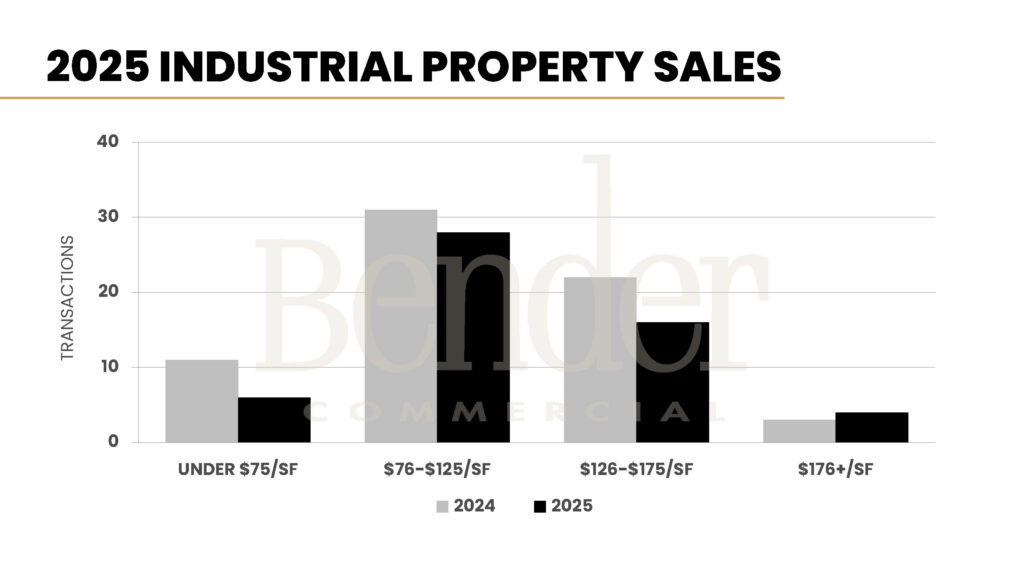
The price-per-square-foot breakdown shows the bulk of 2025 transactions clustered in the $76–$125 range, with significant activity in the $126–$175 range — roughly equivalent to current new construction cost. Buyers recognize that acquiring existing space near replacement cost is attractive when the alternative involves a 12–18 month development timeline.
Industrial Lease Rates by Class
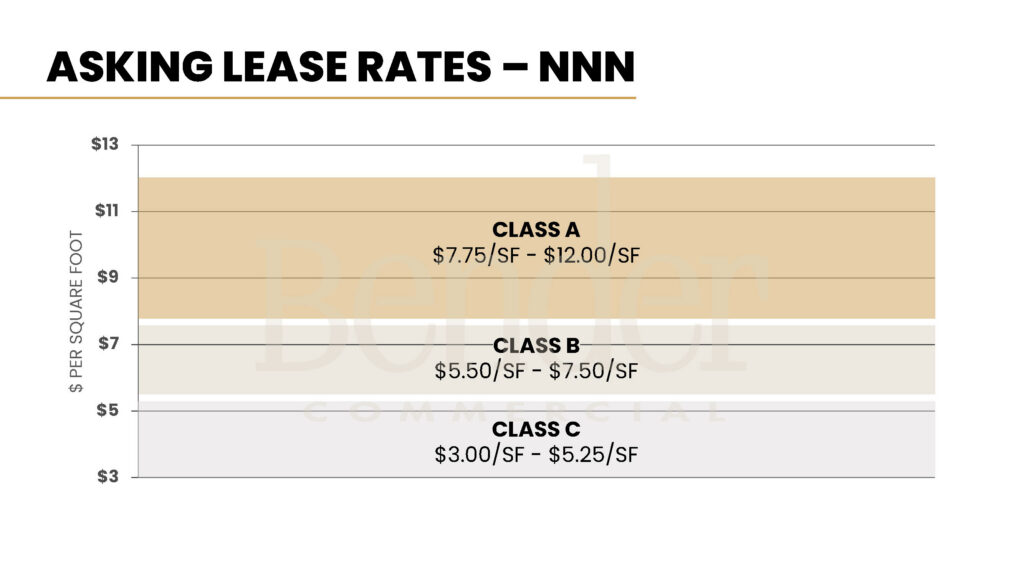
Industrial lease rates in Sioux Falls vary significantly by asset class:
- Class A: $7.75–$12.00 per SF NNN. The wide range reflects the diversity of Class A industrial space — from large distribution facilities to flex properties with retail components, to smaller multi-tenant contractor shops where higher per-SF rates are necessary.
- Class B: $5.50–$7.50 per SF NNN. A tighter, more predictable band consistent with standard warehouse and light manufacturing.
- Class C: $3.00–$5.25 per SF NNN. Older vintage buildings with functional limitations, attracting price-sensitive users.
Average asking rents across the market showed a modest 5.1% decrease from 2024, reflecting supply pressure. Well-located, functional Class A space continues to command premium rates; the softness is concentrated in older product.
Sioux Falls Industrial Real Estate Outlook for 2026
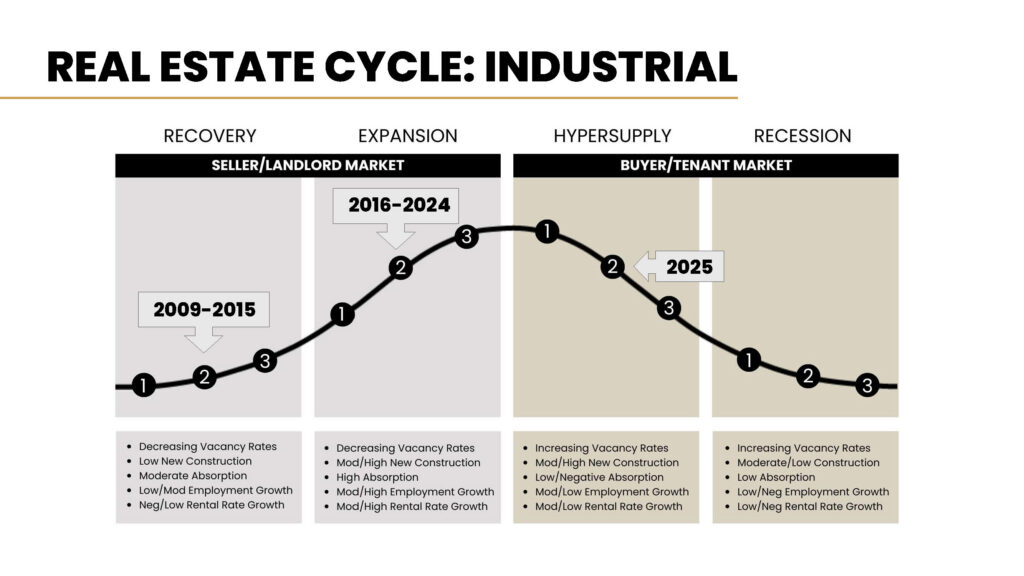
The real estate cycle diagram above captures the industrial market’s remarkable run: from 2009 through 2024 — a 15-year expansion — the market posted consistently strong performance. In 2025, it crossed into hypersupply territory, characterized by rising vacancy, high but moderating construction, and modest rent pressure.
The expectation for 2026 is that the market begins to self-correct. New construction is expected to moderate as developers respond to vacancy signals. Absorption should improve as large buildings like CJ Foods stabilize and as the market backfills existing available space. If those dynamics play out, vacancy will begin trending back down, positioning the market for a return to expansion conditions.
Investment sales transactions are expected to increase — from the mid-50s in 2025 toward the 60s and potentially low 70s — as buyers continue to see value and sellers who have been patient begin to act. Lease rates and sale prices per square foot are expected to hold stable.
For businesses considering industrial space for lease in Sioux Falls, or investors evaluating commercial real estate investment opportunities in the South Dakota industrial market, Bender Commercial’s industrial team has tracked this market through multiple cycles. Current conditions — elevated vacancy creating tenant options, strong investment interest creating liquidity for sellers — make this a productive time to engage.
Ready to talk about what this means for your real estate decisions?
Bender Commercial has guided clients through three decades of Sioux Falls market cycles. Whether you’re evaluating an investment, planning a move, or simply trying to understand what the data means for your business, we’d welcome the conversation.